Blazing-fast bug solving on React apps
Photo by https://unsplash.com/photos/Zq6HerrBPEs
Setup the best bug solving lifecycle and deliver the best user experience
Nowadays, front-end applications or SPA provide rich user interfaces, which comes with technical complexity that produces hard to solve bugs.
How do you handle bug reports in your production front-end applications?
Are you sure you leverage all the existing tools to provide the best user experience by solving bugs in a frictionless and fast way?
This article will expose all existing solutions to improve your bug solving lifecycle and provide the best product experience to your users.
- Introduction: Bug solving lifecycle
- Error reporting solutions
- Session Recording solutions
- Logging solutions
- Conclusion: choose the proper tools
Introduction: Bug solving lifecycle
Bugs on the front-end are particularly nasty, especially given the multi-purpose and asynchronous nature of it: handling data, state, and its impact of rendering, all this linked to the network or user interactions.
Front-end applications are hard to test, most often leading to manual testing with its hard to grasps regressions bugs.
Before digging into the multiple tools that can help to resolve bugs faster, let’s take a closer look at the bug life cycle and its different steps:
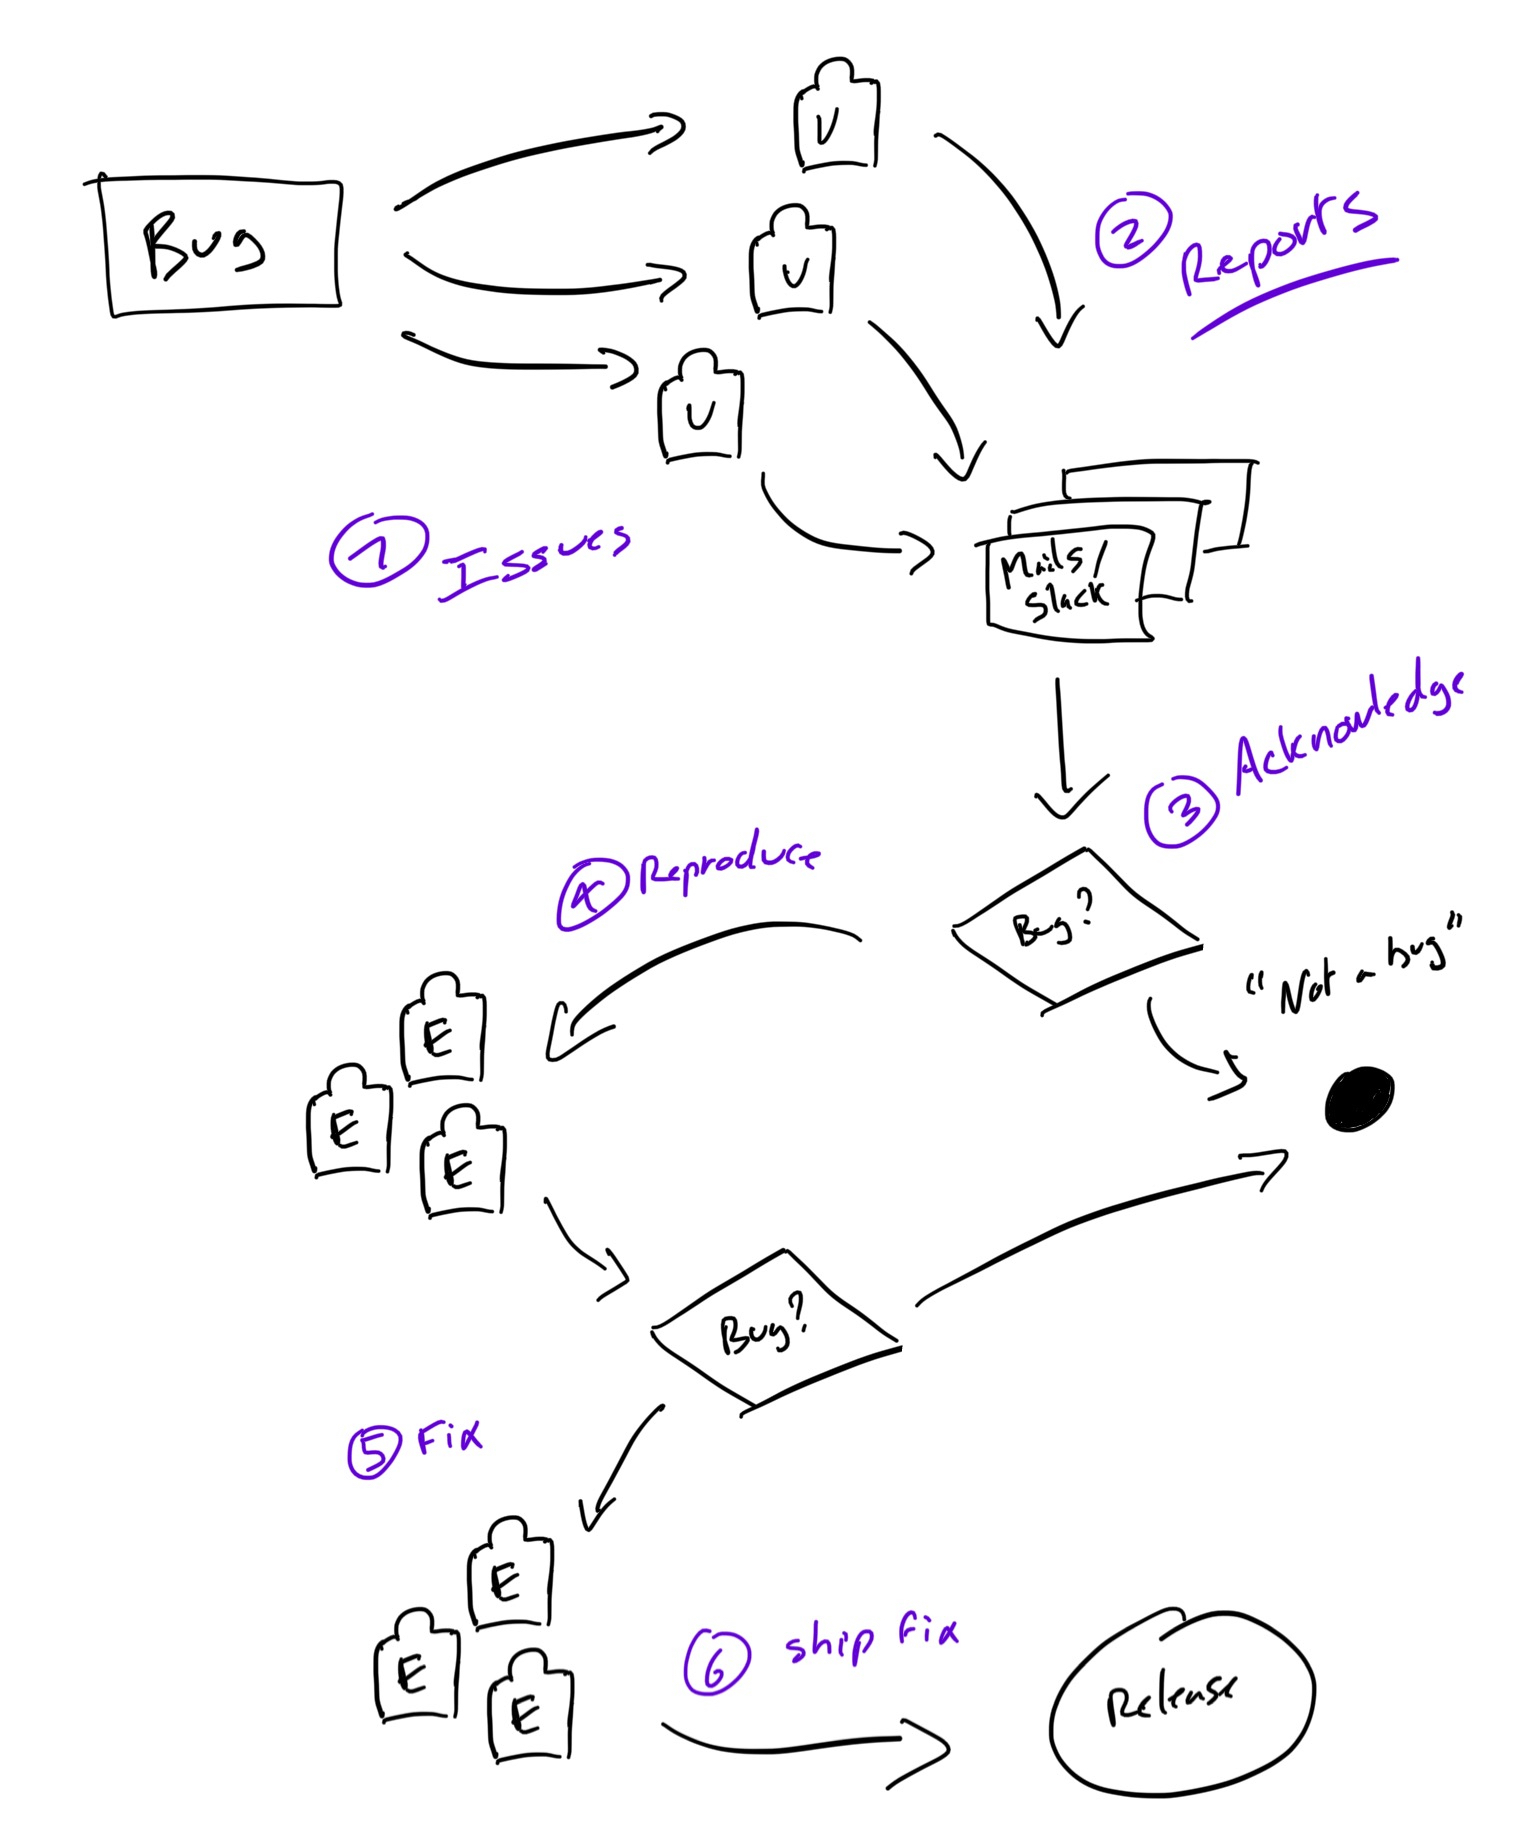
Bug life cycle (U = users, E = Engineers)
- Bug events: one or multiple users are facing an issue - that might be a bug
- Reporting: this results in many reports via Slack, mails, or ticketing software describing the issue faced
- Acknowledge: at this stage, the engineers, given the information, might identify the issue as a bug or not, or might need to dig more to know more.
- Reproducing: One or multiple engineers tries to reproduce the issue and flag it as a bug. Users are informed of the status of the issue when possible.
- Fixing: if the issue is a bug, the engineering team is working on a fix depending on its priority.
- Release fix: The bug fix is ready and released; impacted users are informed of the resolution
Any product/service’s goal is to make those six steps as fast as possible for - at least - critical bugs.
In this article, we will see the different solutions to significantly improve the efficiency of the Bug events, Acknowledge, Reproducing steps of bug resolving.
Enjoying this article so far?
Don't miss my latest publications, talks & updates.
Error reporting solutions
Error reporting solutions’ mission is to catch software errors and exceptions by providing inspection and alerting on top of it.
Let’s take the example of the Sentry error reporting solution.
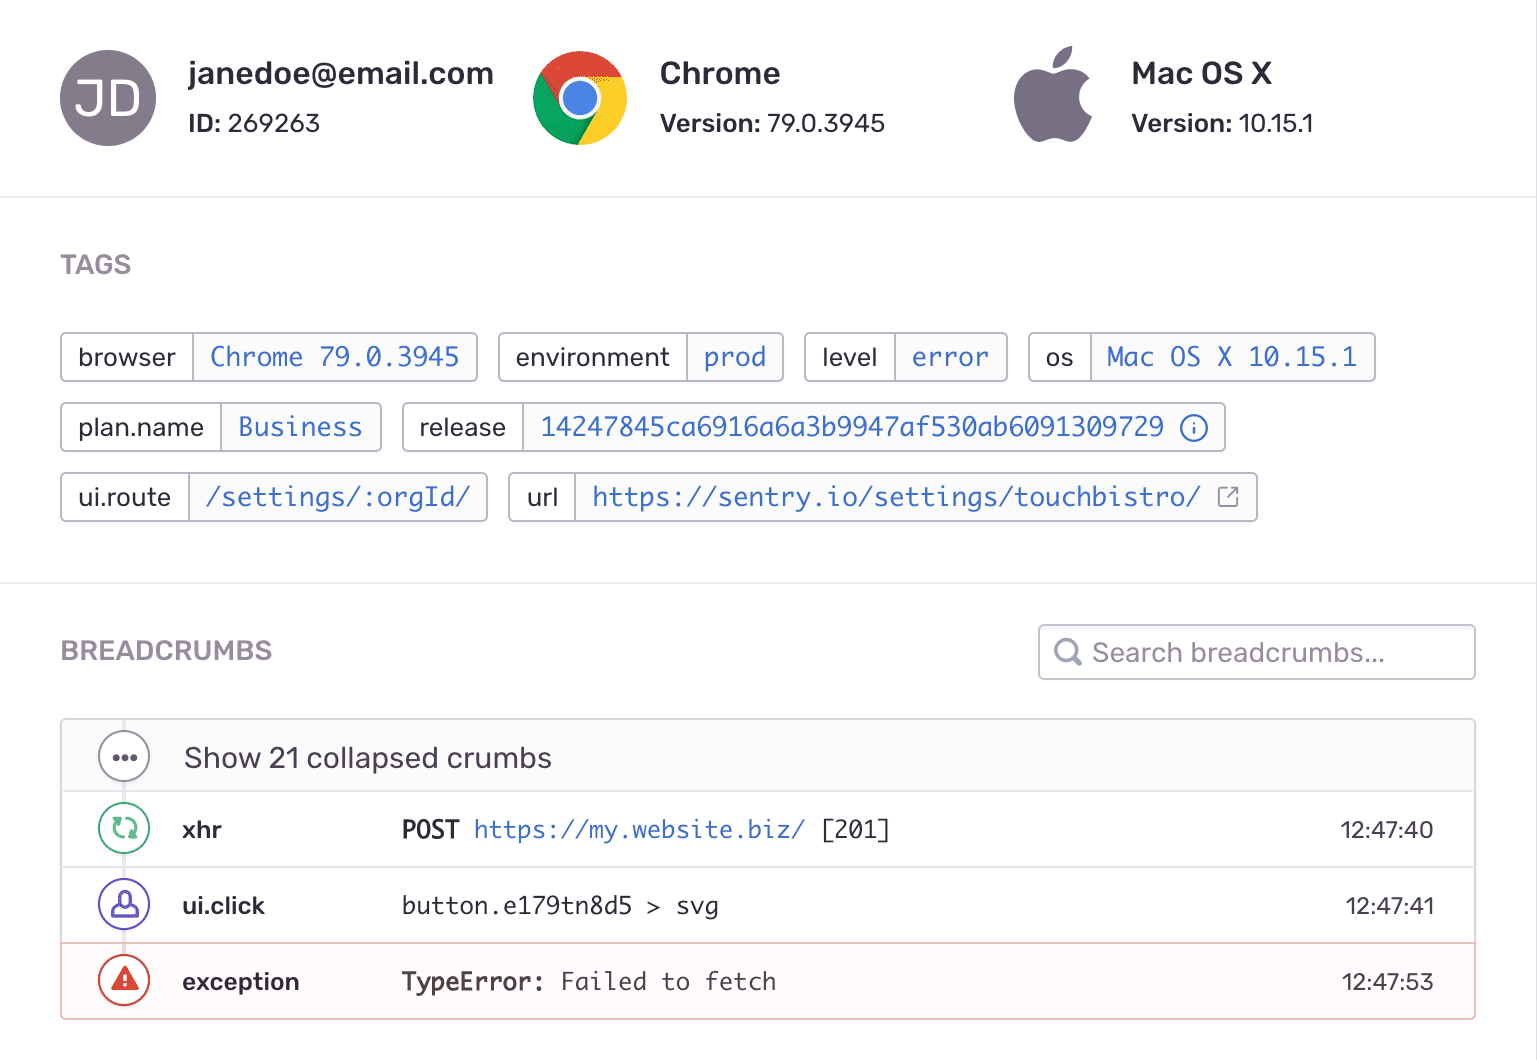
Sentry is providing all the context when a bug occurs.
Error reporting solutions are helping at many stages of the bug life cycle:
- Bug event: properly configuring Sentry Alerts (mail or Slack) will allow you to address bugs before users face them.
- Acknowledge: Any user report should be easy to correlate with the information in Sentry.
- Fixing: First, all the context information (number of unique impacted users, browser types, etc.) will help prioritize the bug; then, the stack trace (especially if source maps are configured) will help you fix the bug faster.
- Release fix: If well configured, your bug, flagged in a specific version will be marked as resolved when a new version is released
On top of improving some steps of the bug lifecycle, an Error Reporting solution like Sentry has many advantages:
First, it is relatively easy to set up in any project and provides React integration with performance monitoring, ajax requests trace, and user interactions.
1import React from "react"
2import ReactDOM from "react-dom"
3import * as Sentry from "@sentry/react"
4
5Sentry.init({
6  dsn: "<PUBLIC_DSN>"
7});
8
9ReactDOM.render(/* … */)
Sentry minimal setup
However, please note that to improve your bug solving lifecycle, you should ensure that your React application has:
- source-maps correctly configured using the @sentry/webpack-plugin package.
- Slack alerts are correctly configured to notify you when bugs events happen.
- Exception types are adequately filtered to avoid noise.
- Release/application version pushed to Sentry to correlate any regression’s version.
Also, make sure to call Sentry in your own React ErrorBoundary or use the Sentry’s one:
1import * as Sentry from "@sentry/react"
2import App from "./components/App"
3
4<Sentry.ErrorBoundary fallback={"An error has occurred"}>
5  <App />
6</Sentry.ErrorBoundary>
Downsides of Sentry
However, Sentry has two significant flaws that make it particularly unpleasant and inefficient to use on big projects or legacy projects with many noisy errors.
First, the Sentry search is really bad, typo tolerance is inexistent, and searching outside of the error message impossible, making it impossible to search without an exact query and harder to navigate projects with lots of errors.
Finally, Sentry relies heavily on sampling errors, dropping new errors that look similar to existing ones if your project sends too many of them.
Those two behaviors make it very hard to use Sentry on large projects: large by the number of errors (ex: on legacy ones) or large by the number of features or users.
Conclusion
Error reporting solutions are acceptable to have an efficient bug solving lifecycle if:
- most of your application bugs directly come from errors from the code
However, if most of your user faced bugs comes from side-effect or state-related issues, an error reporting solution won’t provide sufficient context to solve bugs efficiently
- your errors/exceptions rate is reasonable (below 5k/day)
Error reporting solutions are, most of the time, not of great help on big legacy projects that generate tons of errors and noise (non-critical errors, network issues)
- you configure it correctly by sending the richer context possible
as previously explained, error reporting solutions will help you fix bugs by “guessing what happened”; For this reason, you should provide as much context as possible.
In short, Error Reporting solutions are great for stable and well-tested projects, where, only meaningful and critical errors will end up in the tool to help in solving bugs or even foresee them thanks to alerting.
Session Recording solutions
A contrary approach to “guess why bugs happened” could be to have access to the customer experience while facing the bug, a bit like in the Black Mirror episode “The Entire History of You” (S1E3).
Black Mirror S1E3, “The Entire History of You”
Unlike in Black Mirror, this is a reality in the front-end world, thanks to session recording solutions like LogRocket or FullStory.
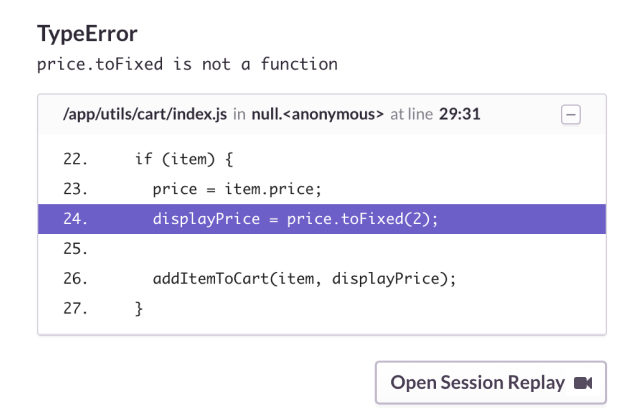
LogRocket allows you to replay a user session when a bug happened.
Like Sentry, LogRocket is easy to setup - all required packages are listed here:
1import React from "react"
2import ReactDOM from "react-dom"
3import LogRocket from 'logrocket'
4import setupLogRocketReact from 'logrocket-react'
5
6setupLogRocketReact(LogRocket)
7
8LogRocket.init("<YOUR_APP_ID>")
9ReactDOM.render(/* … */)
LogRocket React integration allows searching for sessions where the user clicks a specific component in your app. ✨
LogRocket brings an unexpected dream for front-end engineers: being able to go back in time and replay user sessions when they faced issues.
No more “guessing what triggers a specific bug” you can take a seat on your sofa, grab some popcorn and watch the session replay.
On top of that, LogRocket provides the “rage click” feature that allows you to know when a user is “getting annoyed” and starts to click nervously on the UI.
The latter allows you to detect some UX issues on top of the bugs.
Note: LogRocket also brings integration with GraphQL allowing you to get names of queries in the Network panel directly.

Downsides of LogRocket
Session Recording solutions are mainly designed for Product Research and have been repurposed to error reporting, which leads to some flaws compared to more technical solutions.
While LogRocket provides you a friendly “Error Reporting” page that sum-ups critical errors, investigating each one of them means rewatching the user’s full session - since the beginning, which is often multiple minutes long.
The main advantage of LogRocket is also its biggest downside: Privacy.
LogRocket will, out of the box, remove any input content from the recordings; however, any other information (application related) will be visible on the recordings (chat content, etc.).
To sanitize the information specific to your application, you will have to indicate which part should be ignored in the DOM, as it follows:
1<div data-private>
2  This data will <strong>not</strong> be recorded.
3</div>
Conclusion
Session recording solutions are a game-changer in solving bugs if:
- most of your bugs are related to state problems or UI-complexity
As mentioned earlier, watching a session recording is time-consuming and would waste time on exceptions or too technical bugs.
- your application does not contain too much sensitive data
If your application contains too much sensitive data, you will have to exclude many UI elements/zones from recording; therefore, you will lose most of the necessary bug solving context.
- your errors/exceptions rate is reasonable (below 5k/day)
As stated earlier, Session recording solutions are primarily designed for Product purposes and are not intended to handle a large case of errors.
You will face the same issues as error reporting solutions: sampling, lousy search.
To conclude, Session recording solutions are great for small and stable projects with complex user interfaces that lead to bugs complex to reproduce.
Logging solutions
You are already familiar with logging, thanks to console.log, however, console.log is meant to emit messages to the browser’s console, not to the engineer - when deployed to a production environment.
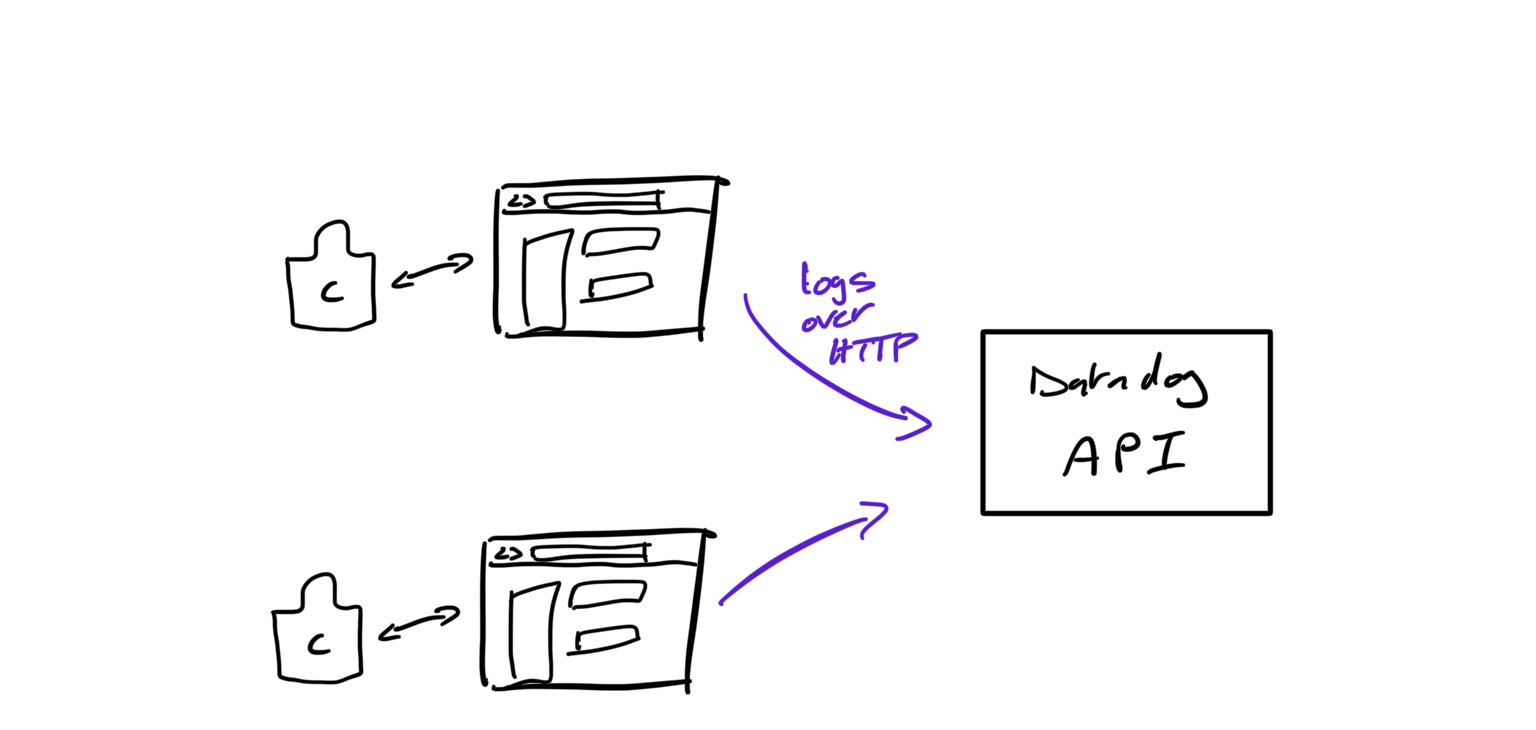
The idea of “logging solutions” is similar to console.log; however, you will send those “log messages” to a service like Datadog - over HTTP - in order to be able to access them in a centralized way remotely.
This practice, prevalent in the backend ecosystem, is the most complete and flexible way to achieve the best bug solving lifecycle - in my humble opinion.
Downsides
Since I’m advocating for this solution, let’s be fair by talking about the significant downsides of using logging: lots of manual set up.
Just replacing all the console.log of your react application with logger.log() will not be sufficient to set up an efficient bug solving life cycle by leveraging logging.
On top of installing and configuring Datadog - or other - in your application, you will have to categorize the type of log events you will send to use them properly - a bit like Segment.
Finally, the last downside of Datadog and similar solutions might be very technical usability.
Unlike Error Reporting or Session Recording solutions that provide friendly end-user interfaces, most of the time, working with Logging solutions will be looking at records of logs (text) or charts.
Proper set up to solve bug faster
As explained in the downsides, logging requires more work on the setup side; let’s have a walkthrough together.
Initialize client
First, as in previous solutions, you will have to initialize a client:
1import { datadogLogs } from '@datadog/browser-logs'
2
3datadogLogs.init({
4  clientToken: '<TOKEN_CLIENT_DATADOG>',
5  site: 'datadoghq.com',
6  service: ‘<YOUR_APP_NAME>’, // example: mycompany_spa
7  version: ‘<YOUR_APP_VERSION>’,
8  forwardErrorsToLogs: true, // errors that bubble to window should be sent
9  sampleRate: 100, // forward all logs, no sampling
10})
Initializing a Datadog client is similar to Sentry or LogRocket.
What to log
Just replacing all the console.log of your react application with logger.log() will not be sufficient to set up an efficient bug solving life cycle by leveraging logging.
We will have to define the different types of “event” that we will log; here is an example:
- Errors forwarding
This one is not a “type of event”; however, it is good to remember that, as configured in our Datadag client, any uncaught errors will be sent to Datadog.
- Application errors
Your application has to handle some expected state of errors (network, state), whenever it’s conditional (if/else) or promise based (try/catch).
Let’s ensure that any caught error is tracked and sent to Datadog to identify the root cause of users’ issues.
- User interactions
Ensure log events when users perform any action in the critical path of the application, in other terms, any vital feature of your product.
Doing so will significantly help in identifying the possible initial root cause of a bug.
- Application internal state
Logging events like “tab focused,” “online/offline” navigation, or app lifecycle (init user, session, routing) events might be useful to understand tricky bugs.
This is a basic outline that provides all the essential log events to have an efficient bug solving life cycle.
Any extension to it should keep in mind, as a rule of thumb, to define and track different types of log events that will help to understand how the application is behaving given a user-session - like we define Segment events for marketing purposes: "Subscribed", "Clicked Pricing."
How to log events
Sending log events is simple:
1import { datadogLogs } from '@datadog/browser-logs'
2
3datadogLogs.logger.log(<MESSAGE>,<ATTRIBUTS_JSON>,<STATUT>)
4
5
6// Examples:
7
8// Application error
9datadogLogs.logger.log("Error while creating a task", { userID: 1, workspaceID: 1 }, "error")
10
11// User interactions
12datadogLogs.logger.log("Create task", { source: "list", userID: 1, workspaceID: 1 }, "info")
13
14// Application internal state
15datadogLogs.logger.log("Session initialized", { userID: 1, workspaceID: 1 }, "debug")
Note the `` parameter that changes depending on the event’s type.
Use logs
Once your production application is sending log events, Datadogs allows you to create alerts and dashboards on top of them.
Alerts
Alerts, like for Sentry, will allow you to define Slack or email notifications based on rules applied to logs, for example:
Send an alert if there is 30% more "error" events in the last hour compared to the hour before.
Datadog Alerts are very powerful and help to detect issues before users face them.
Dashboards
You can also define Dashboards that will contain real-time charts based on log events:
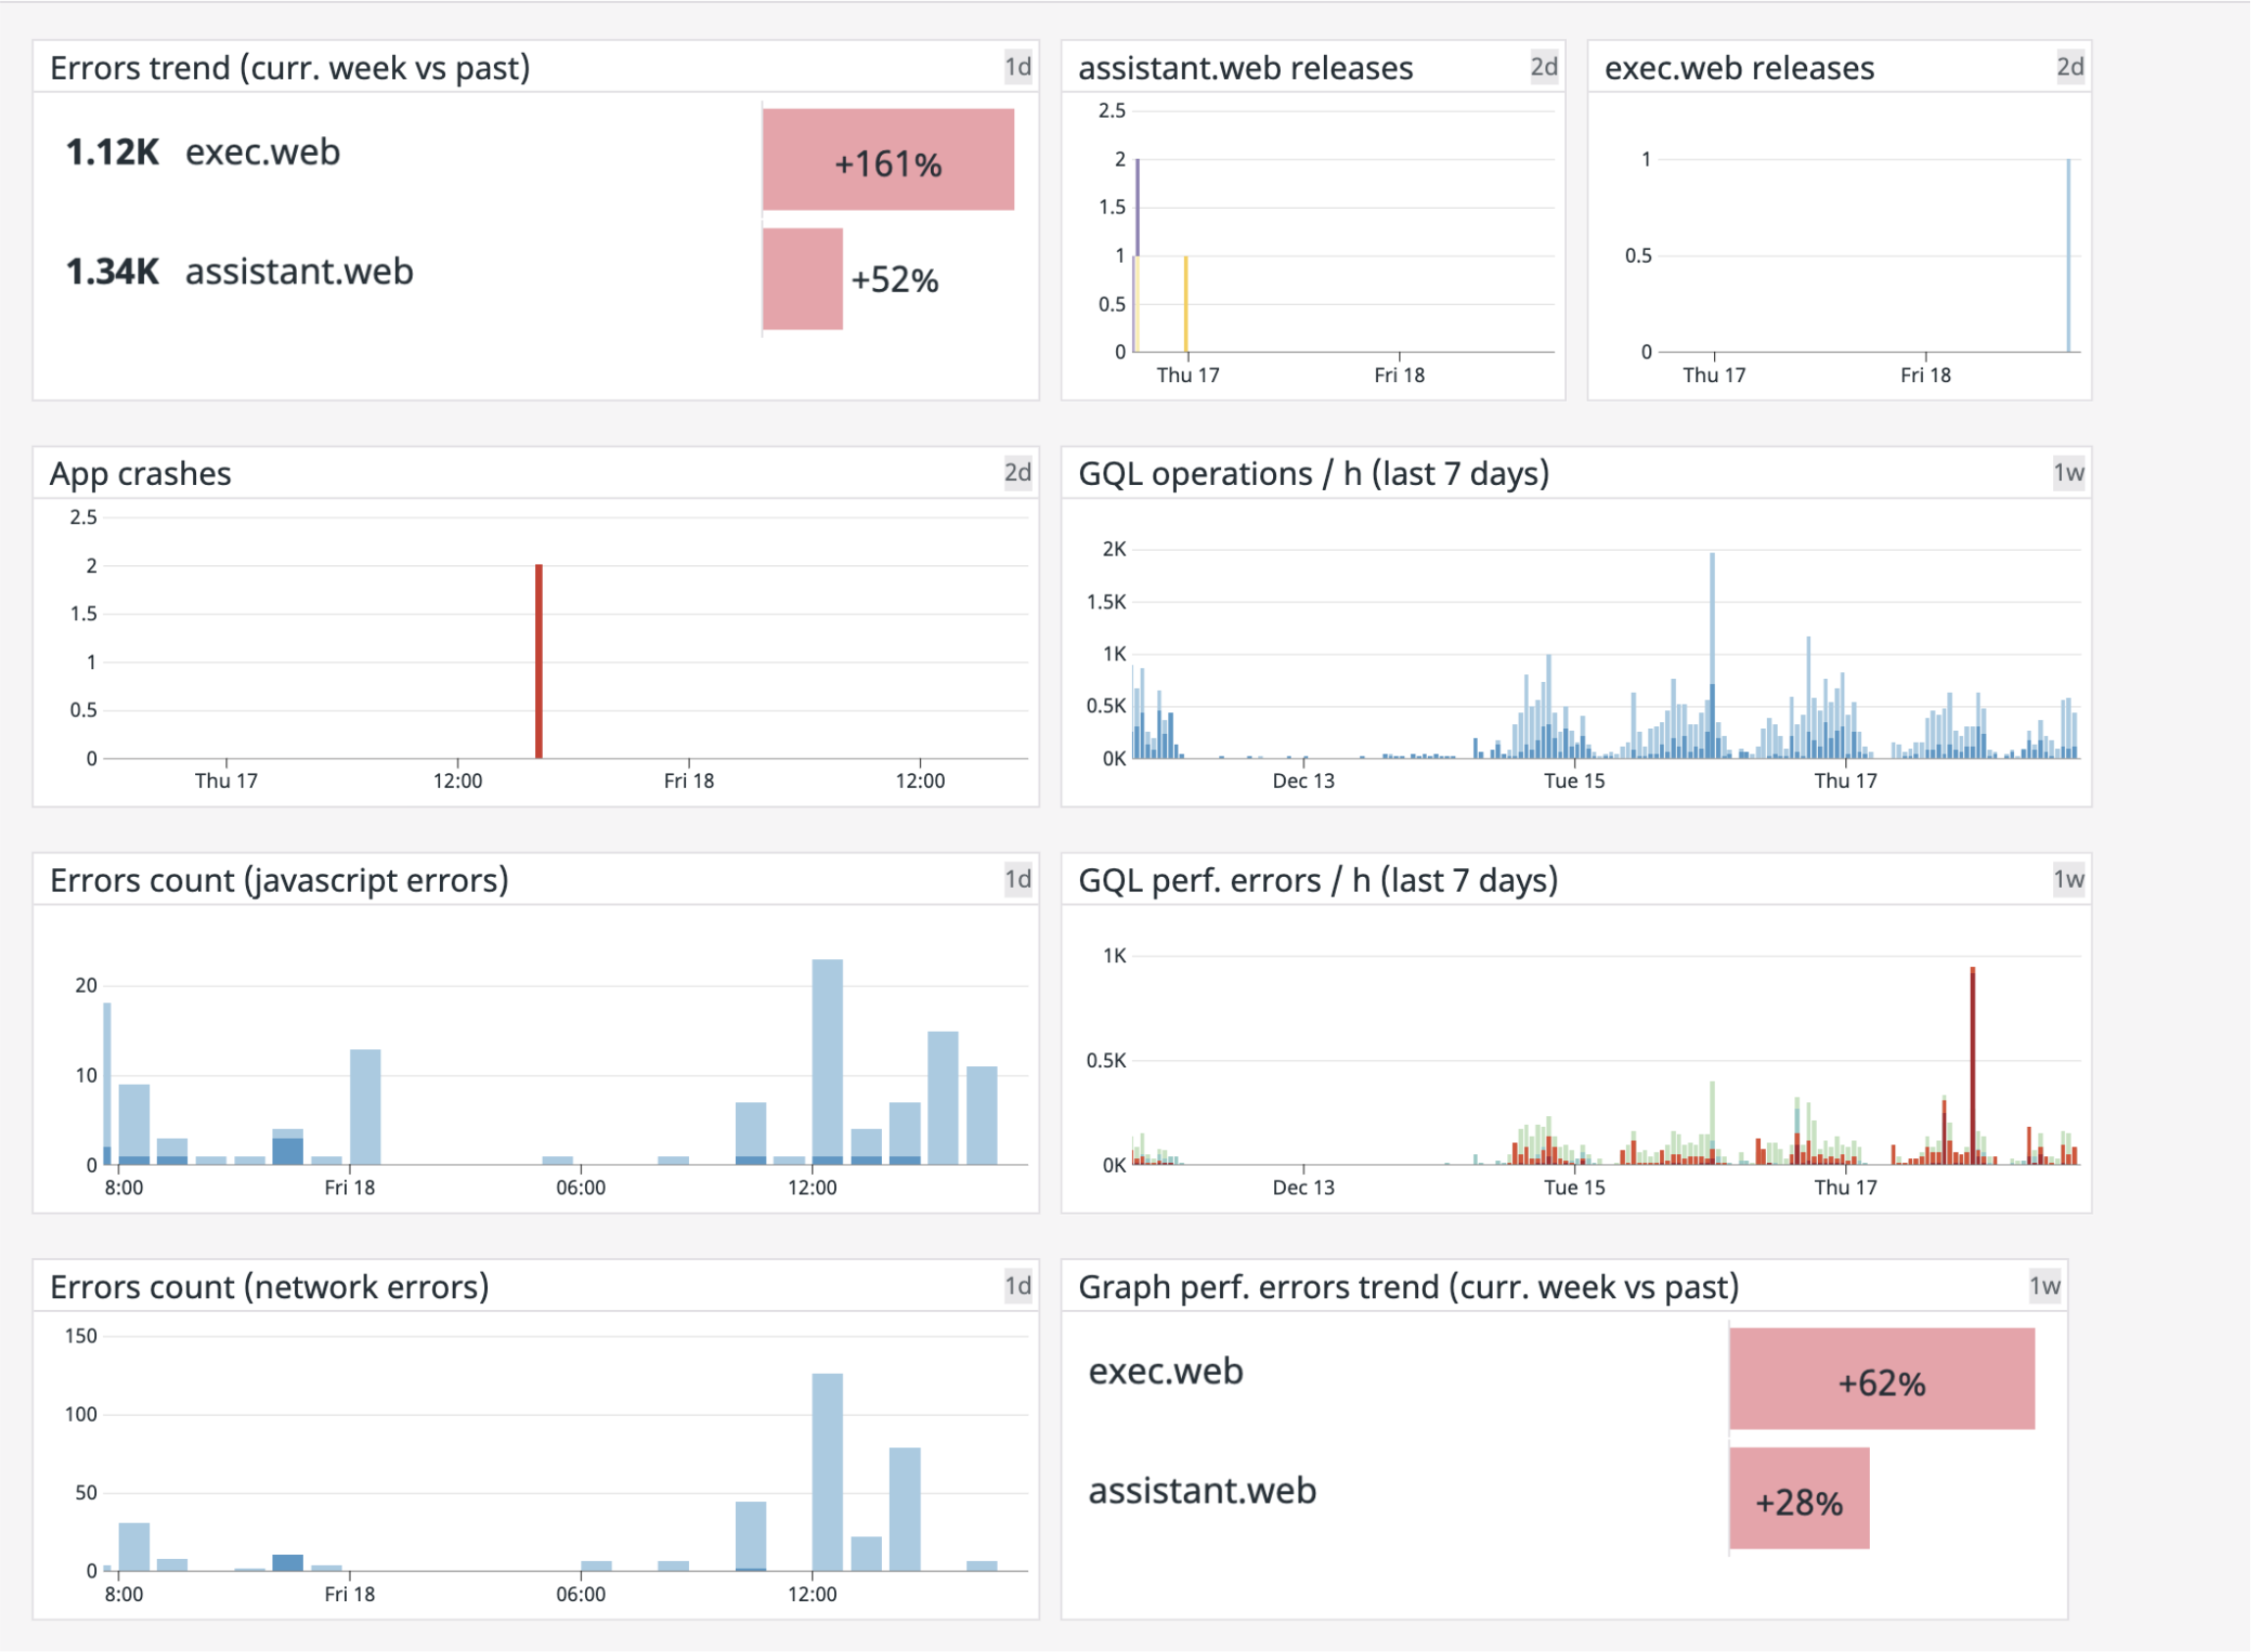
Example of React applications dashboard
Dashboards give a high-level overview of your application health, allowing you, again, to detect issues before users face them.
Tips: you can, at any time, select a time-frame and open the related logs in the Log Explorer - see next paragraph.
Log Explorer
The Alerts and Dashboard help to anticipate issues (Bug events step of the bug life cycle).
The Log Explorer is helping in making the Acknowledge and Reproducing blazing-fast steps.
When a user reports an issue, you will be able, using its internal userId to get all the related logs in a recent time-frame and isolate them by session - a Datadog session is defined by the arrival and leave of user of the application).
Once the proper timeframe is identified, you will have a rich and complete overview of the application (internal state, application errors, uncaught errors, and other custom log events) and the user interactions.
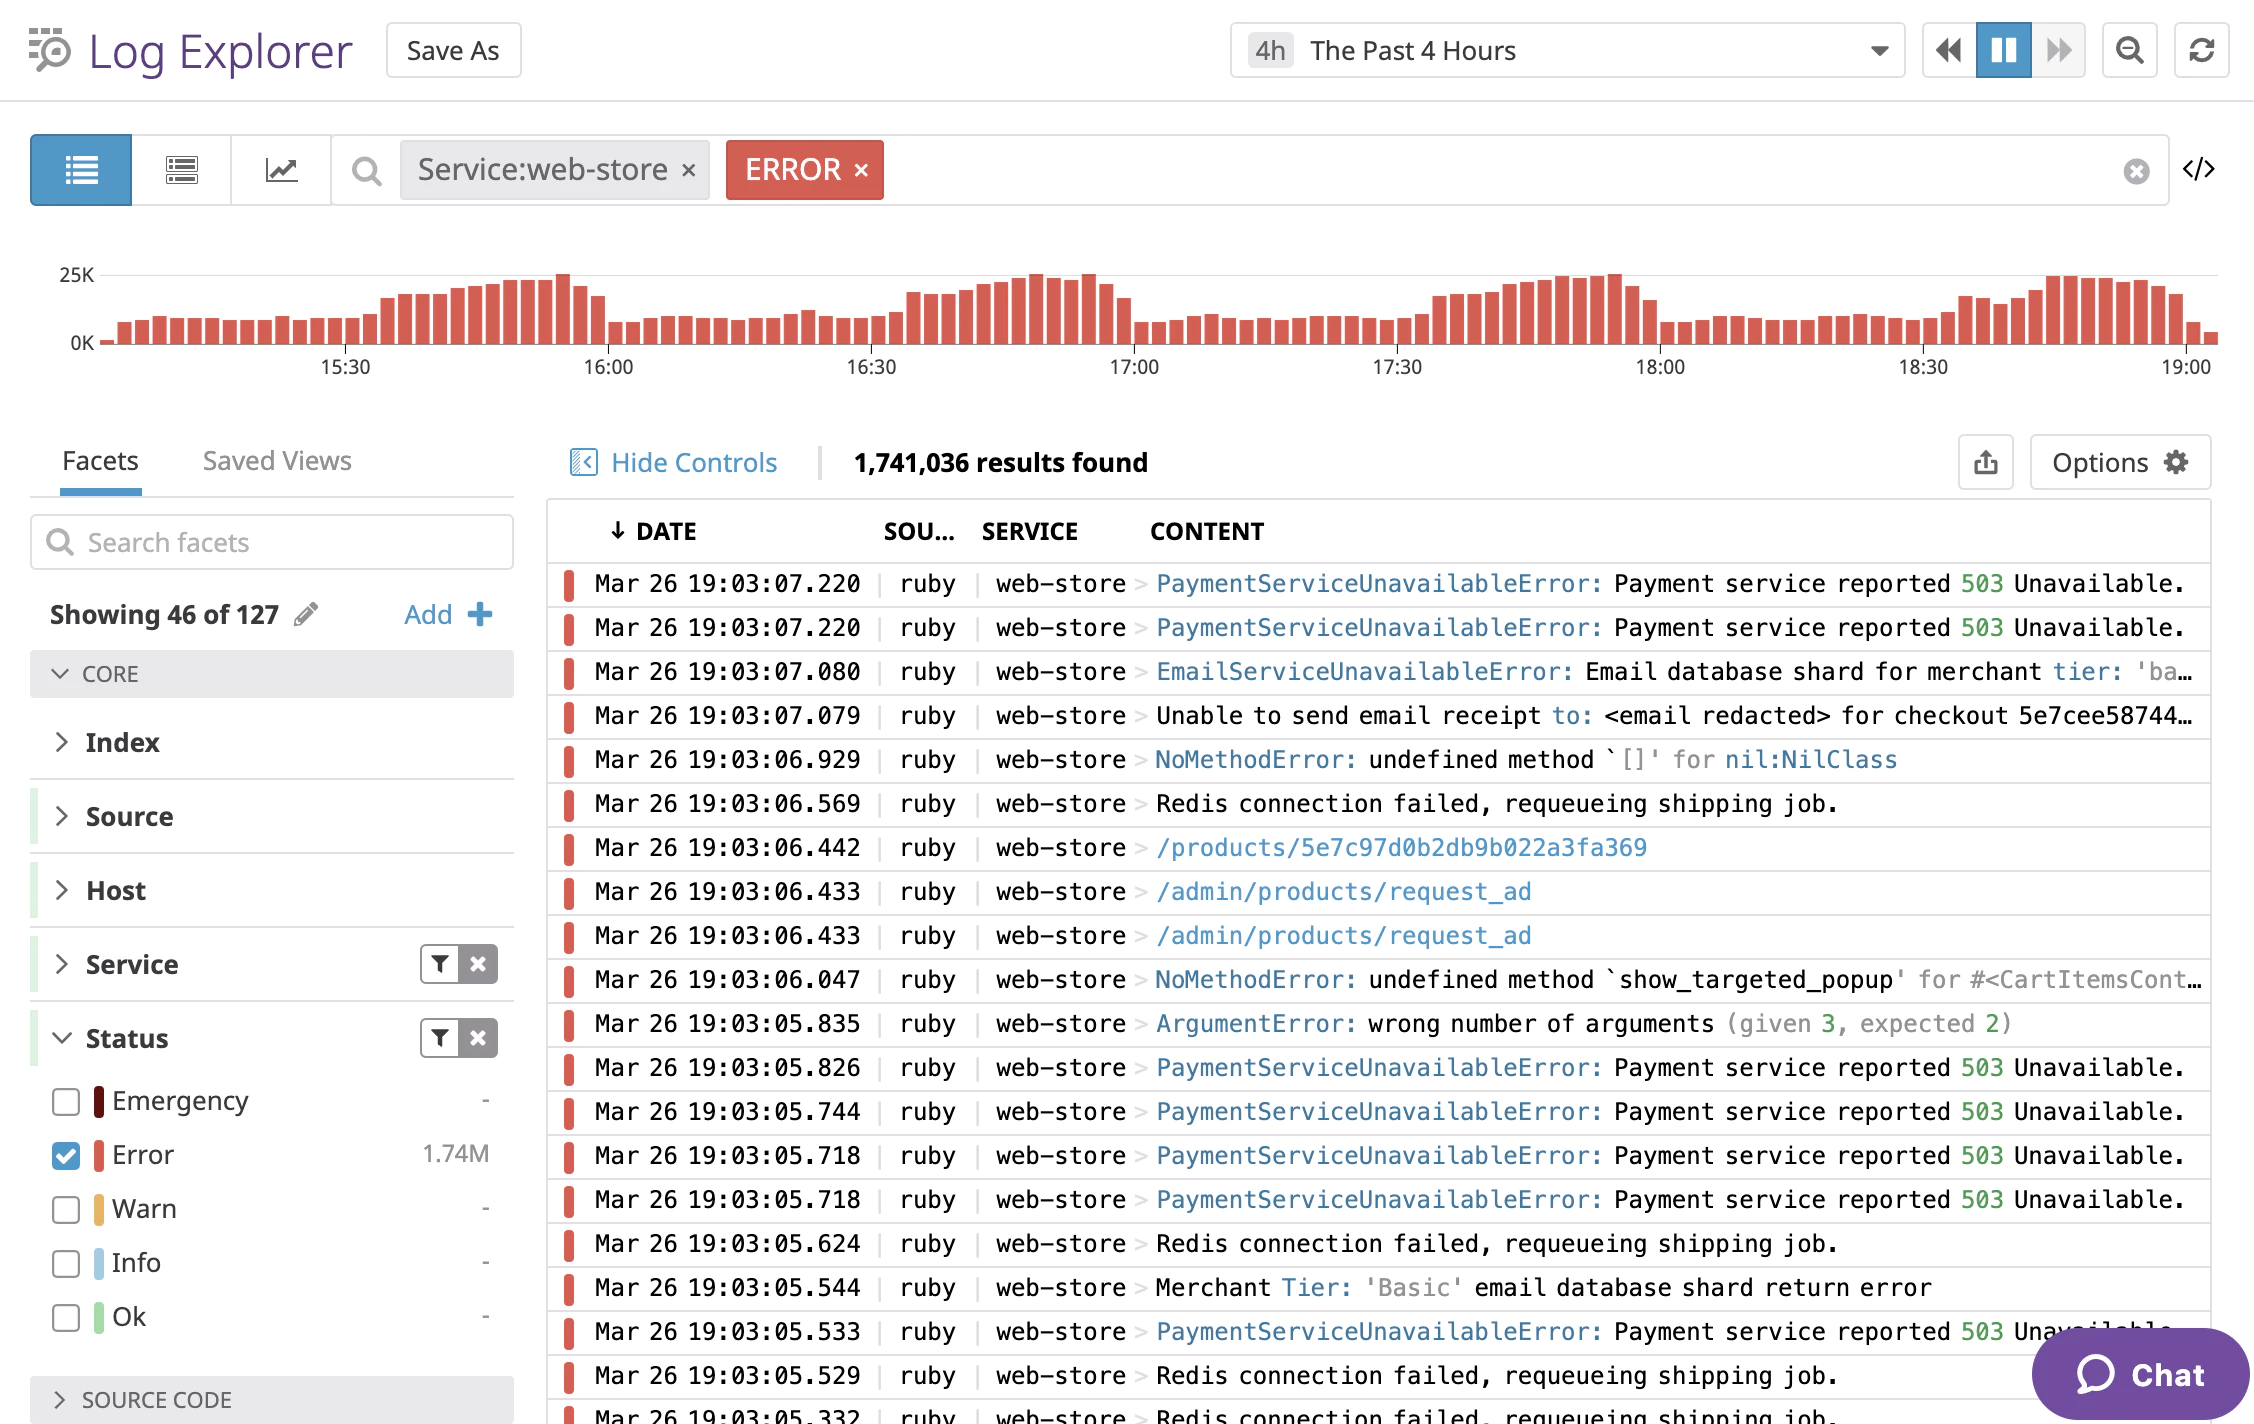
Screenshot of Datadog’s Log Explorer, here with a Ruby API’s logs
Conclusion
Logging is a great solution to get an efficient bug solving life cycle if:
- you are working on a high-technical debt application
High-technical debts application tends to raise both side-effect or state-related issues and code error/exceptions related issues.
Logging is a great way to have all the context to cover all kinds of issues.
- you are willing to invest time in the observability and bug management of your application
As we saw in the downsides and the set-up sections, Logging required both an extensive manual set-up and a learning curve on the complexity of the technical interfaces of logging solutions.
- your errors/exceptions rate is off the roof (above 5k/day)
Logging solutions are especially good at storing a large amount of data.
Especially, solutions like Datadog will allow you to make sense of this large amount of data thanks to its powerful search and its dashboards.
To sum-up, Logging consists of building a tailored control panel of your application(s) by defining what is essential to track your application.
While it is the most expensive solution, it is also the most powerful one, especially game-changing when working on big or legacy front-end application(s).
Note: Datadog also proposes a “Real User Monitoring” feature that automatically tracks the main KPI without any custom manual logging: page load, errors (with source maps support), page views, and then allows you to indicate your “custom user actions.”
Once set up, you will have an “out of the box” dashboard; however, you will still have to create and configure some alerts.
Conclusion: choose the proper tools
I used each of those solutions over the years on different projects of different size and maturity.
As underlined in each solution’s conclusion, each project, depending on its size, technical debt, and bugs sources, should privilege a specific solution.
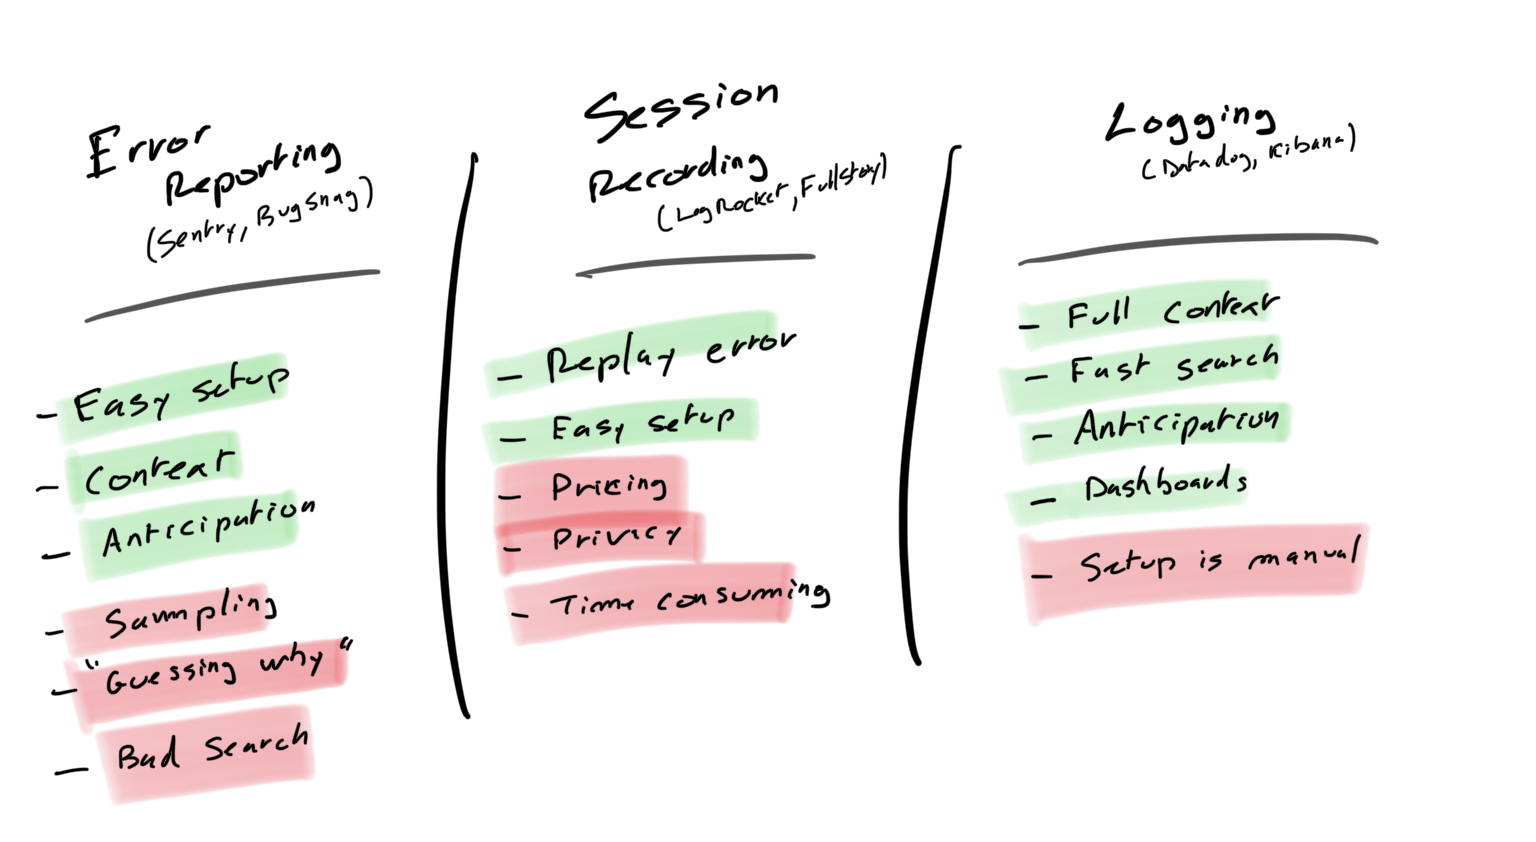
Session recording solutions will help you solve state-related or user input related bugs faster; however, it might be complicated to maintain on applications that handle a lot of sensitive data.
Error reporting solutions are great to solve bugs on simple apps, especially when most user-facing issues are code error/exceptions related (lack of robust PR review process); however, error reporting won’t help to have a clear view of what is going wrong on large or high-technical debt projects.
Finally, Logging solutions, more cumbersome to set up and maintain, is a game-changer when working on big and legacy front-end application(s), allowing you to get full inspections on how the application behaves and an overview on high-level trends.
Don't miss my latest publications, talks & updates.
We use cookies to collect statistics through Google Analytics.


