
Build performance reports for your Apollo React Components in 30 minutes

An AWS experiment
Motivation
We started a big project few months ago: migrate our application to GraphQL.
With 300+ React Component and 20 API endpoints with many nested ressources, the maintainability and performance of the application were getting worse every month.
Once this project finished, we wanted to ensure that GraphQL fulfil his promises, so we decided to track migrated components “perceived performance”.
We wanted to watch the performance of our GraphQL Ruby API over time and avoid UX/performance regression.
Considering that we already use a lot of external SASS (NewRelic, Cloudinary, AWS, Segment, OAuth0, …), instead of building a full AWS data ELK stack, we decided to build a simple and low-cost performance “dashboard”.
Since our Segment account save all raw data in a S3 bucket, we decided to use this data by sending a custom event Perfomance.QueryLoadTime .
Note: Segment is a SASS Analytics API that provide integrations with 200+ services like Hubspot, custom webhooks or AWS.
The Architecture
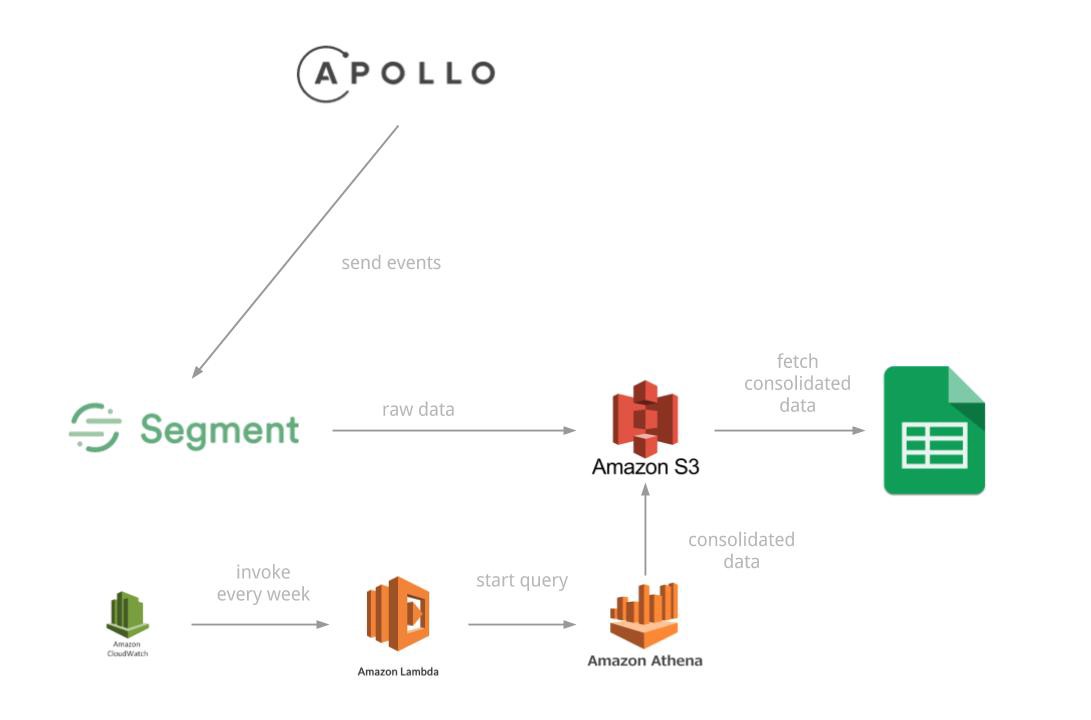
Of course, Segment can easily be replaced by AWS Kinesis Firehose and AWS API Gateway
The front React application is sending a custom Perfomance.QueryLoadTime event to Segment each time a specific GraphQL request end.
The event is then stored in S3 as JSON raw data files.
The event is then stored in S3 as JSON raw data files.
Then, every week, the data is fetched from S3 and consolidated, ready to be used in Google Sheets.
Let’s see how to make it work out !
The implementation
1. Send performance data — setup Apollo with Segment
Apollo Data is a GraphQL client compatible with React
For this, we need to write a custom link that intercept some filtered queries and send performance data to Segment.
You’ll see below a JasonBourne service.
Don’t worry, this is our Segment client wrapper.
Don’t worry, this is our Segment client wrapper.
1import { ApolloLink, NextLink, Operation } from 'apollo-link';
2import { JasonBourne } from '../../../service/Marketing/JasonBourne';
3
4const PERF_MONITORED_OPERATIONS = [
5    'loadChatsList',
6    // ...
7];
8
9export const perfMonitorLink = new ApolloLink((operation: Operation, forward?: NextLink) => {
10    const startTime = new Date().getTime();
11    return forward ?
12        forward(operation).map(result => {
13            const operationName = operation.operationName;
14            const ellapsedMs = new Date().getTime() - startTime;
15
16            if (PERF_MONITORED_OPERATIONS.includes(operationName)) {
17                JasonBourne.track({
18                    name: 'Performance.QueryLoadTime',
19                    operationName,
20                    ellapsedMs
21                });
22            }
23
24            return result;
25        }) :
26        null;
27});
It’s all.
All you have to do is to add this link to your ApolloClient instance.
All you have to do is to add this link to your ApolloClient instance.
1export const client = new ApolloClient({
2  link: ApolloLink.from([perfMonitorLink, networkLink]),
3  cache: apolloCache
4});
You’re all set for the front part.
2. Build consolidated data — Setup AWS Athena
Athena is a service of Amazon that allow to run SQL queries against S3 files.
Configuring Athena is quite easy, you need to:
- create a database
- create a table by specifying a source and the data structure
- create a named query and save it
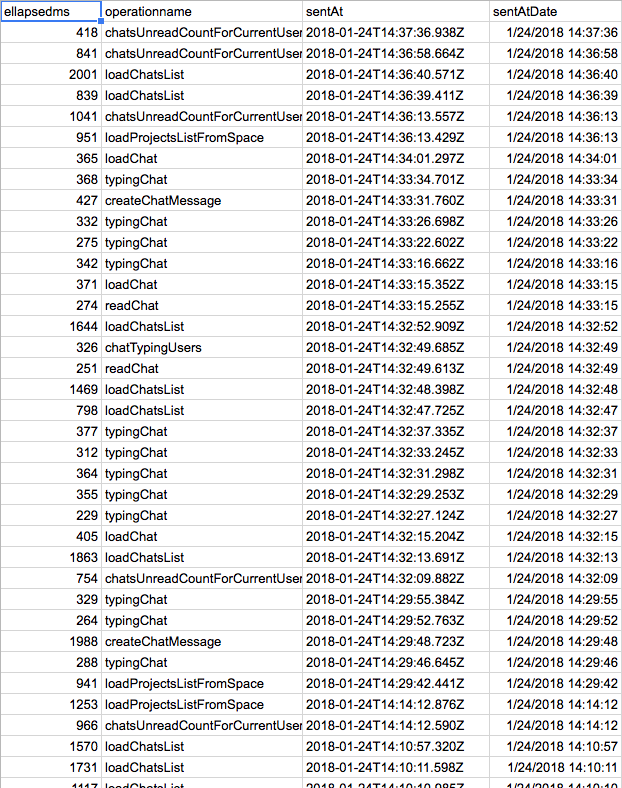
2.1 The data
Here is the raw data structure that Segment store to S3
(for the Perfomance.QueryLoadTime event)
(for the Perfomance.QueryLoadTime event)
1{
2    "anonymousId": "<removed>",
3    "context": {
4        "library": {
5            "name": "analytics.js",
6            "version": "3.2.5"
7        },
8        "page": {
9            "path": "<removed>",
10            "referrer": "<removed>",
11            "search": "",
12            "title": "A line",
13            "url": "<removed>"
14        },
15        "userAgent": "<removed>",
16        "ip": "<removed>"
17    },
18    "event": "Performance.QueryLoadTime",
19    "messageId": "<removed>",
20    "properties": {
21        "ellapsedMs": 1175,
22        "operationName": "loadChatsList"
23    },
24    "receivedAt": "2018-01-05T13:59:14.454Z",
25    "sentAt": "2018-01-05T13:59:14.373Z",
26    "timestamp": "2018-01-05T13:59:14.452Z",
27    "type": "track",
28    "userId": null,
29    "channel": "client",
30    "originalTimestamp": "2018-01-05T13:59:14.371Z",
31    "projectId": "<removed>",
32    "version": 2
33}
You’ll notice that many field are not relevant for data analysis, so we’re gonna only keep a subset.
2.2 Create a database and a table
Note: The “Create table” UI available on AWS Athena do not allow to create table with complex data structure (nested field, union type field, etc), so we need to write a create table query, by hand ✍️
Athena use a Apache HIVE language to describe data, here is the wanted CREATE TABLE query :
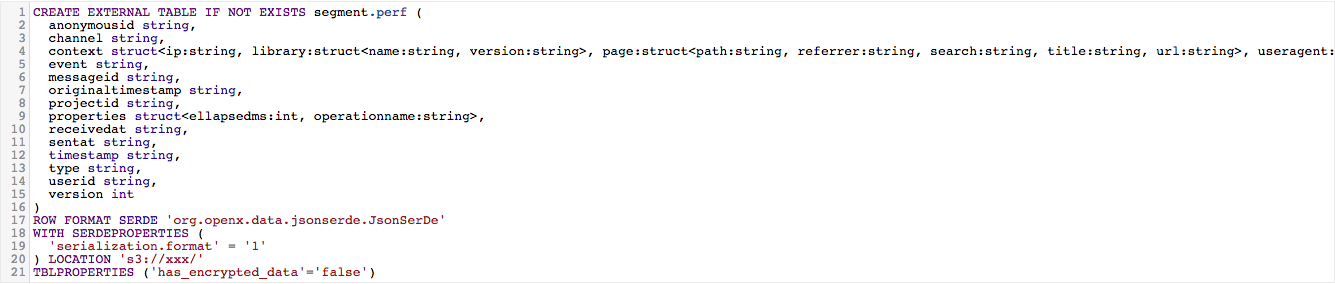
The query expose the data format (JSON), data structure, the source and the destination
To do so, we can use a wonderful tool called [hive-json-schema](https://github.com/quux00/hive-json-schema) .
This is an open source project — recommended by AWS official documentation — to generate HIVE query from JSON raw data.
This is an open source project — recommended by AWS official documentation — to generate HIVE query from JSON raw data.
In short, given a JSON example file, it generate a corresponding CREATE TABLE query.
Read the doc, it’s really simple (take 5 minutes maximum).
2.2.1 Write and save a SELECT Query
The table is now ready, we can write a SELECT query.
Here’s ours:
Here’s ours:
1SELECT
2  properties.ellapsedMs, properties.operationName, sentAt
3FROM "segment"."perf" WHERE
4  event = 'Performance.QueryLoadTime'
5ORDER BY sentAt DESC;
Since it’s plain SQL, you can select all the field available on this table.
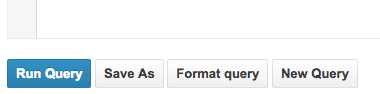
Run the query and save it.
NB: each time a query is executed, Athena store the CSV result on your S3.
To know where (which bucket), go to Settings.
To know where (which bucket), go to Settings.
Problem
Athena do not propose to run a saved query periodically.
However, we can use the AWS Athena API to run a query remotely.
Next step, the lambda.
However, we can use the AWS Athena API to run a query remotely.
Next step, the lambda.
2.2.2 Keep data fresh — Setup a periodic AWS Lambda
AWS Lambda is a service that allow to create serverless functions.
Serverless architectures refer to applications that significantly depend […] on custom code that’s run in ephemeral containers (Function as a Service or “FaaS”)[…] . By using these ideas, […], such architectures remove the need for the traditional ‘always on’ server system sitting behind an application. Depending on the circumstances, such systems can significantly reduce operational cost and complexity at a cost of vendor dependencies and (at the moment) immaturity of supporting services.
We don’t want to go on AWS Athena UI every week to run the saved query manually, so we need a Lambda that run our query very week.
Here’s how to do so:
- Create a periodic lambda
- Ensure lambda have sufficient rights to call Athena and store results to S3
2.2.2.1 Create a “periodic lambda”
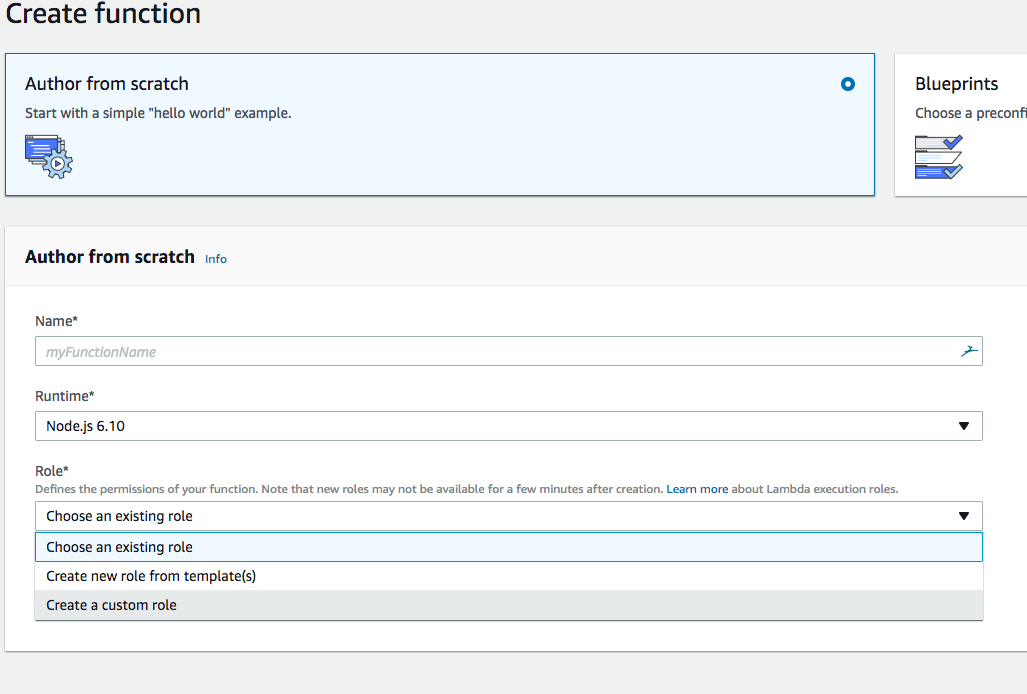
Go to “Create Function” and select “Node 6.10” and “Create a custom role”.
You’ll be redirect to AWS IAM, click on “Allow”.
Please write down the name given to the IAM role, it will be used later.
You’ll be redirect to AWS IAM, click on “Allow”.
Please write down the name given to the IAM role, it will be used later.
Then click on “Create Function”.
2.2.2.2 Select a trigger
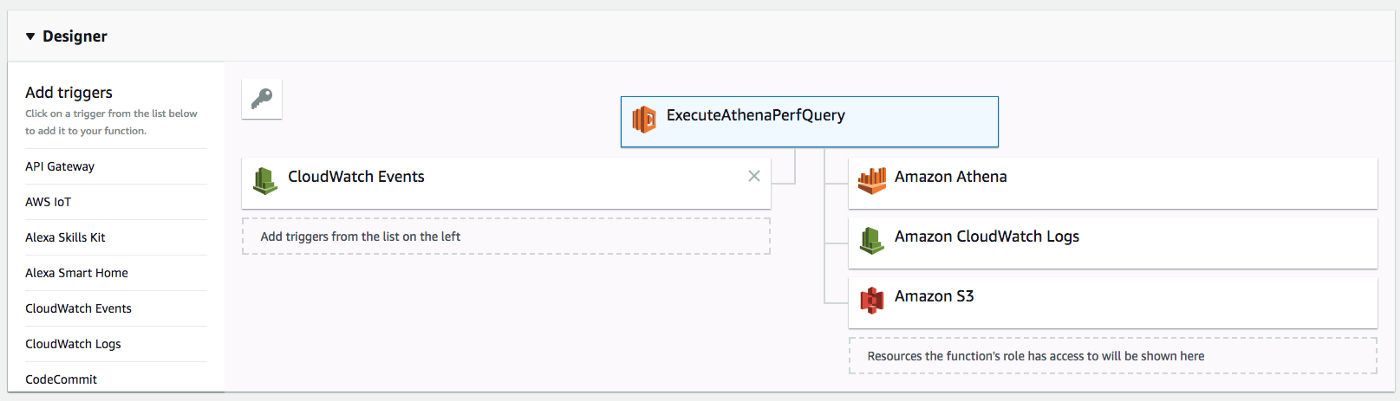
You should land on the page above.
In order to run, a lambda need to be invoked.
We want to invoke our lambda on a weekly basis, like a CRON task.
We want to invoke our lambda on a weekly basis, like a CRON task.
AWS Cloudwatch offer this feature.
On the left, select “CloudWatch Events”, then use this configuration :
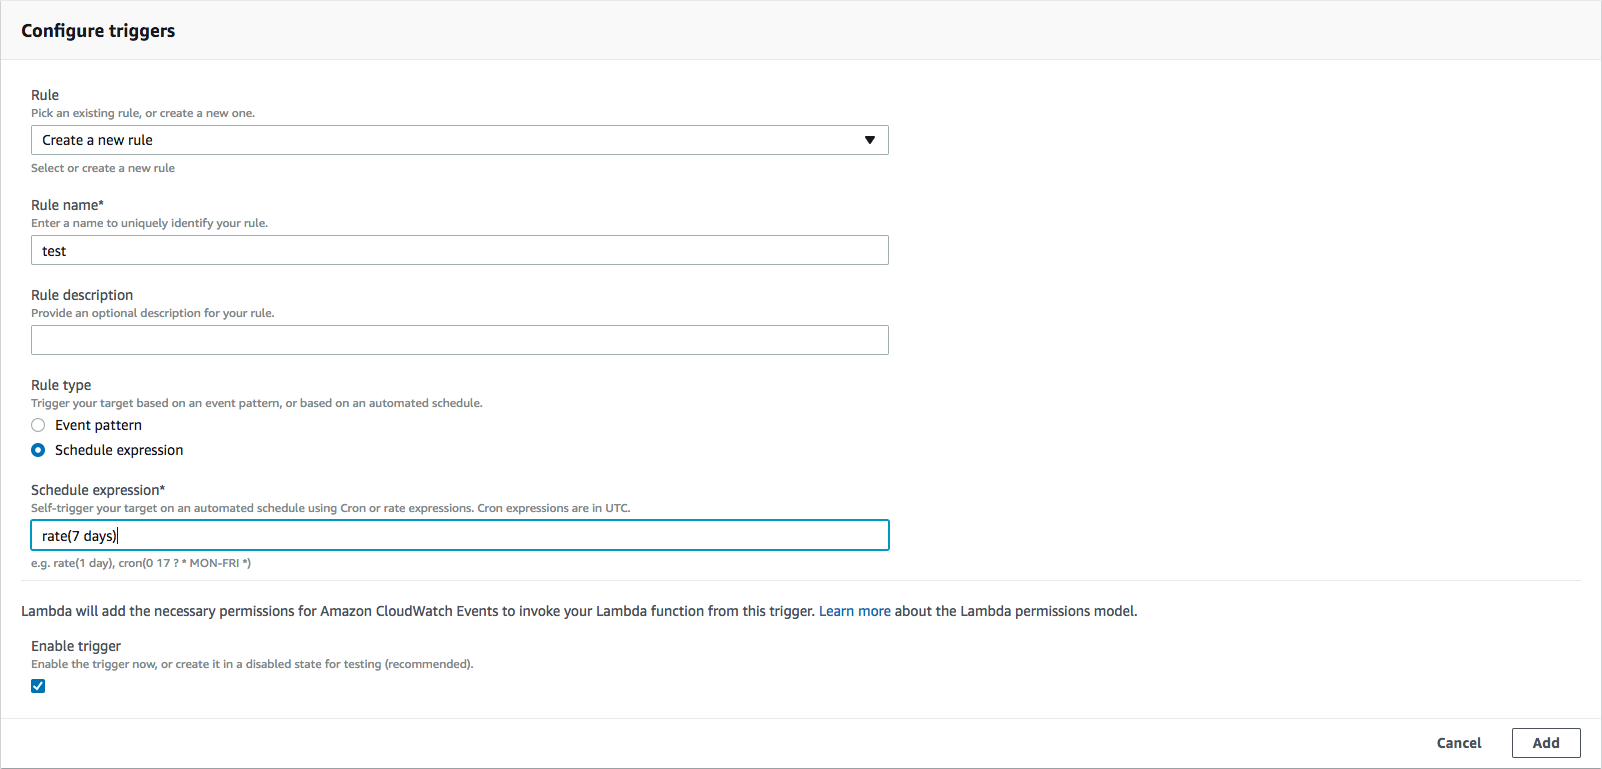
The lambda will be invoked by a Cloudwatch event every 7 days.
2.2.2.3 The lambda IAM role
This is the nifty part, you’ll need to go to IAM and find the role you just created.
Then ensure that the role has the following permissions:
- Athena: GetNamedQuery, StartQueryExecution
- S3: ListBucket, CreateBucket, PutObject, ListAllMyBuckets
This will allow the lambda to find run a query and store it results on S3.
NB: I highly encourage you to dig in the AWS IAM documentation in order to understand all the implications.
2.2.2.4 The lambda code
The lambda must :
- Get the named query by id
- Start the query
- Terminate lambda execution
1exports.handler = (event, context, callback) => {
2    var AWS = require('aws-sdk');
3    AWS.config.update({region: 'eu-west-1'}); // configure region
4    const athena = new AWS.Athena();
5
6    athena.getNamedQuery({ NamedQueryId: '<your-query-id>' }, function(err, data) {
7        console.log('getNamedQuery', err, data);
8        if (!err) {
9            var params = {
10              QueryString: data.NamedQuery.QueryString,
11              ResultConfiguration: {
12                OutputLocation: 's3://<your-bucket-name>/<folder>',
13              },
14              QueryExecutionContext: {
15                Database: 'segment'
16              }
17            };
18            athena.startQueryExecution(params, function(err, data) {
19              console.log('startQueryExecution', err, data);
20              if (err) {
21                callback(err);
22              } else {
23                callback(null, 'query started');
24              }
25            });
26        } else {
27            callback(err);
28        }
29    });
30
31};
NB: To get your Athena Query ID, open the query from Athena “Saved Queries” and copy the id from the URL

3. Displaying data — Configure Google Spreadsheet
Now the consolidated data is fresh and available, we need to :
- get the consolidated data
- format date field — if any
- build a pivot table
- build a chart
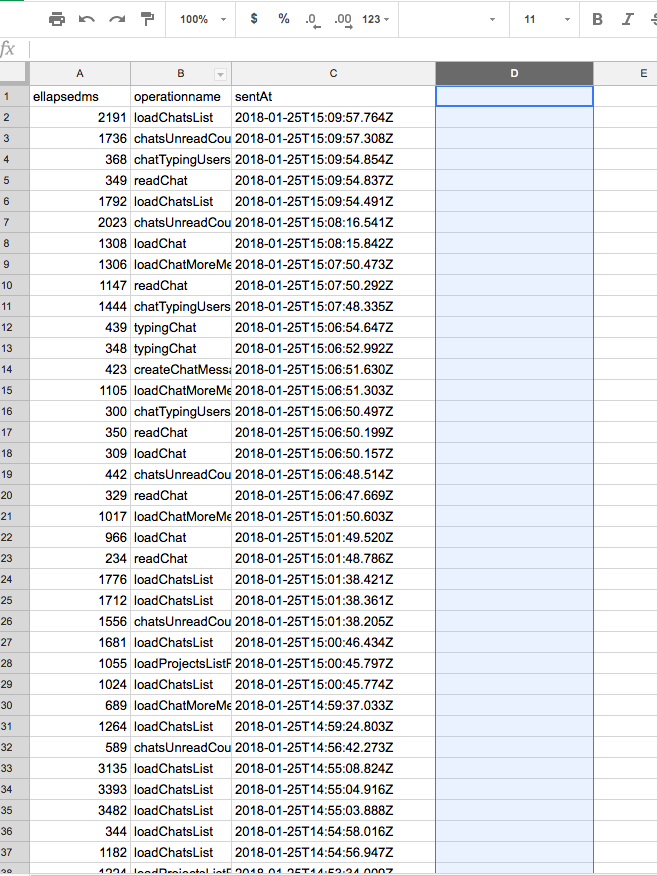
3.1 Copy the content of the last CSV file created by AWS Athena
You’ll find the file in the bucket specified in the Lambda source code.
Remember, we specified a custom output location to the AWS Athena start query call.
Remember, we specified a custom output location to the AWS Athena start query call.
Copy the content of the file, and paste it in a new sheet.
3.2 Format data
In case you’re dealing with date field, here’s a trick.
Google Spreadsheet do not understand the ISO date format, we need to “format” it.
Here is the formula, apply it to a whole new column for each needed field.
Here is the formula, apply it to a whole new column for each needed field.
1= DATEVALUE(MID(C2,1,10)) + TIMEVALUE(MID(C2,12,8))
2
Here you’ll get a “MM/DD/YYYY HH:MM:SS” format ⤴️
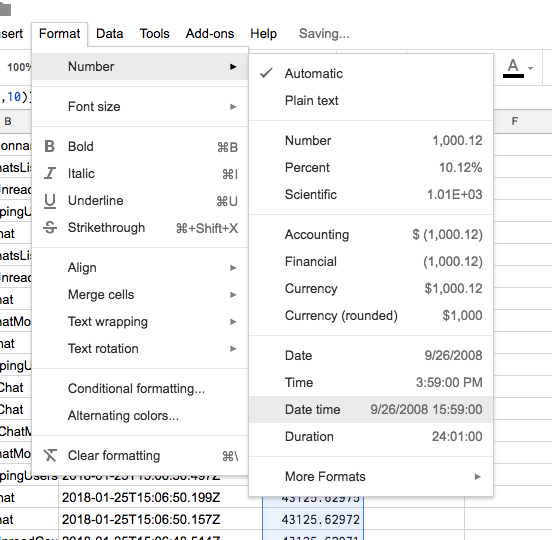
Remember to change the column format to “Date time”
3.4 Build the “pivot table”
The consolidated CSV data is no yet usable.
Since the data use many dimensions (sentAt, operationName) for a single value (elapsedMs), we need to build a “matrix/pivot table”.
Since the data use many dimensions (sentAt, operationName) for a single value (elapsedMs), we need to build a “matrix/pivot table”.
For this, create a new sheet and go to “Data>Pivot table …”
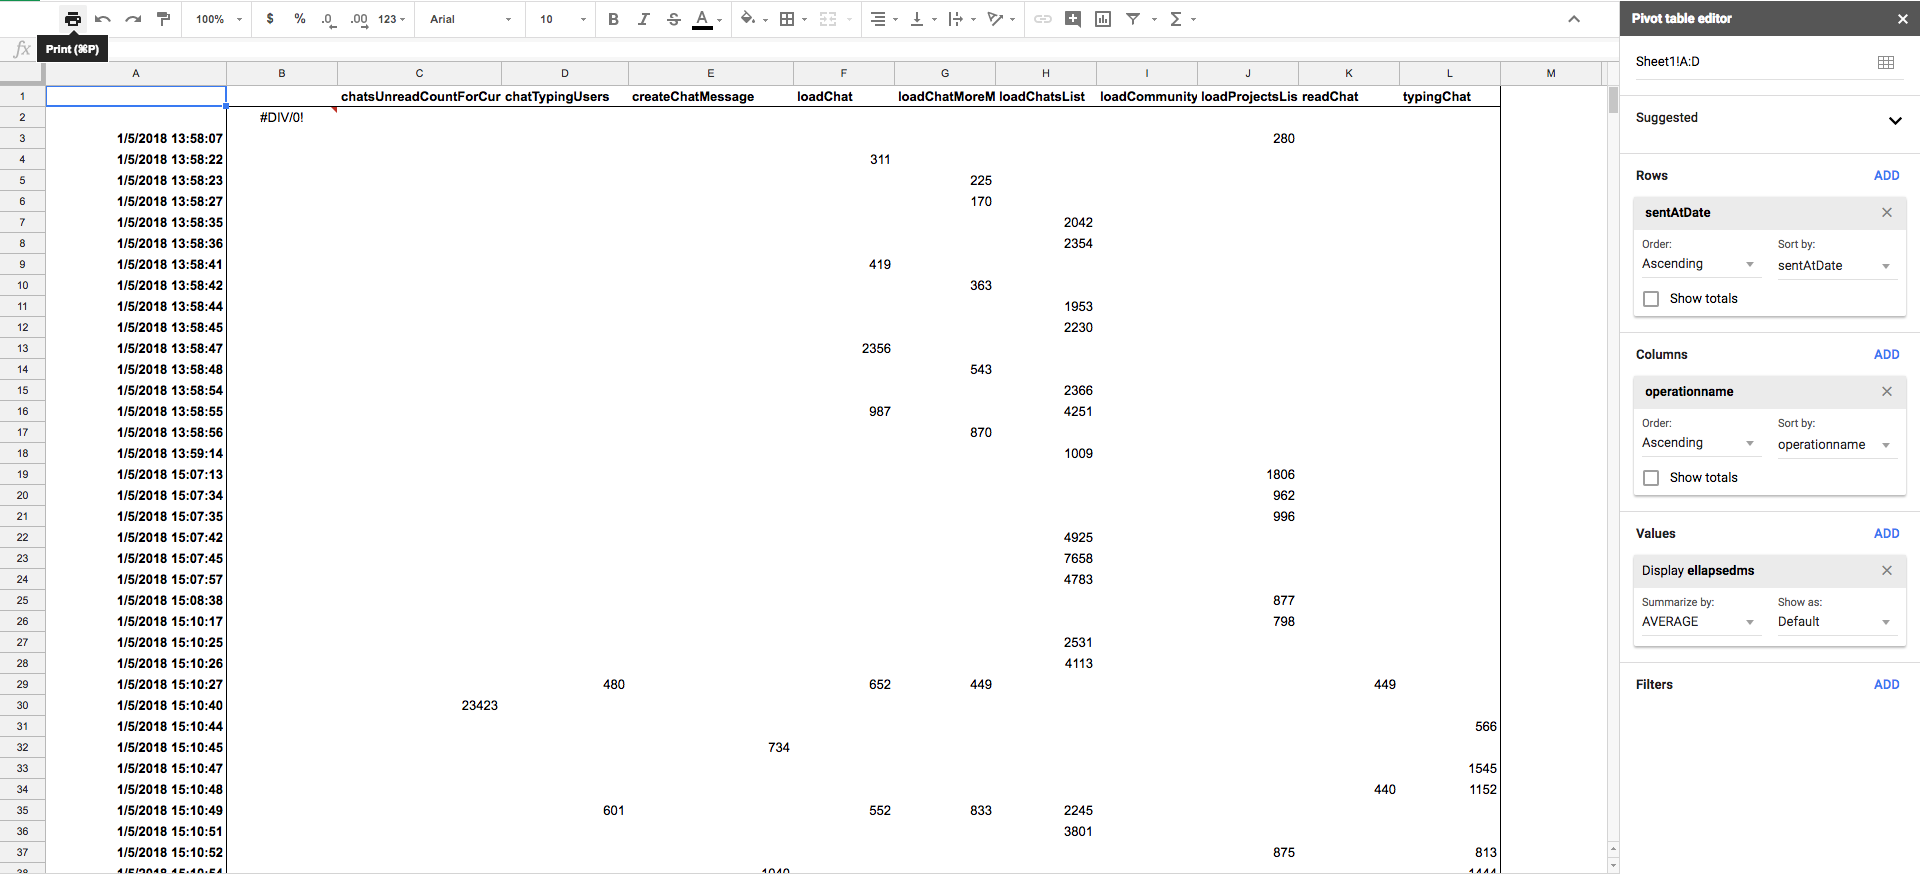
Here is an example of pivot table configuration, it’s very “data-specific”.
3.5 Configure the chart
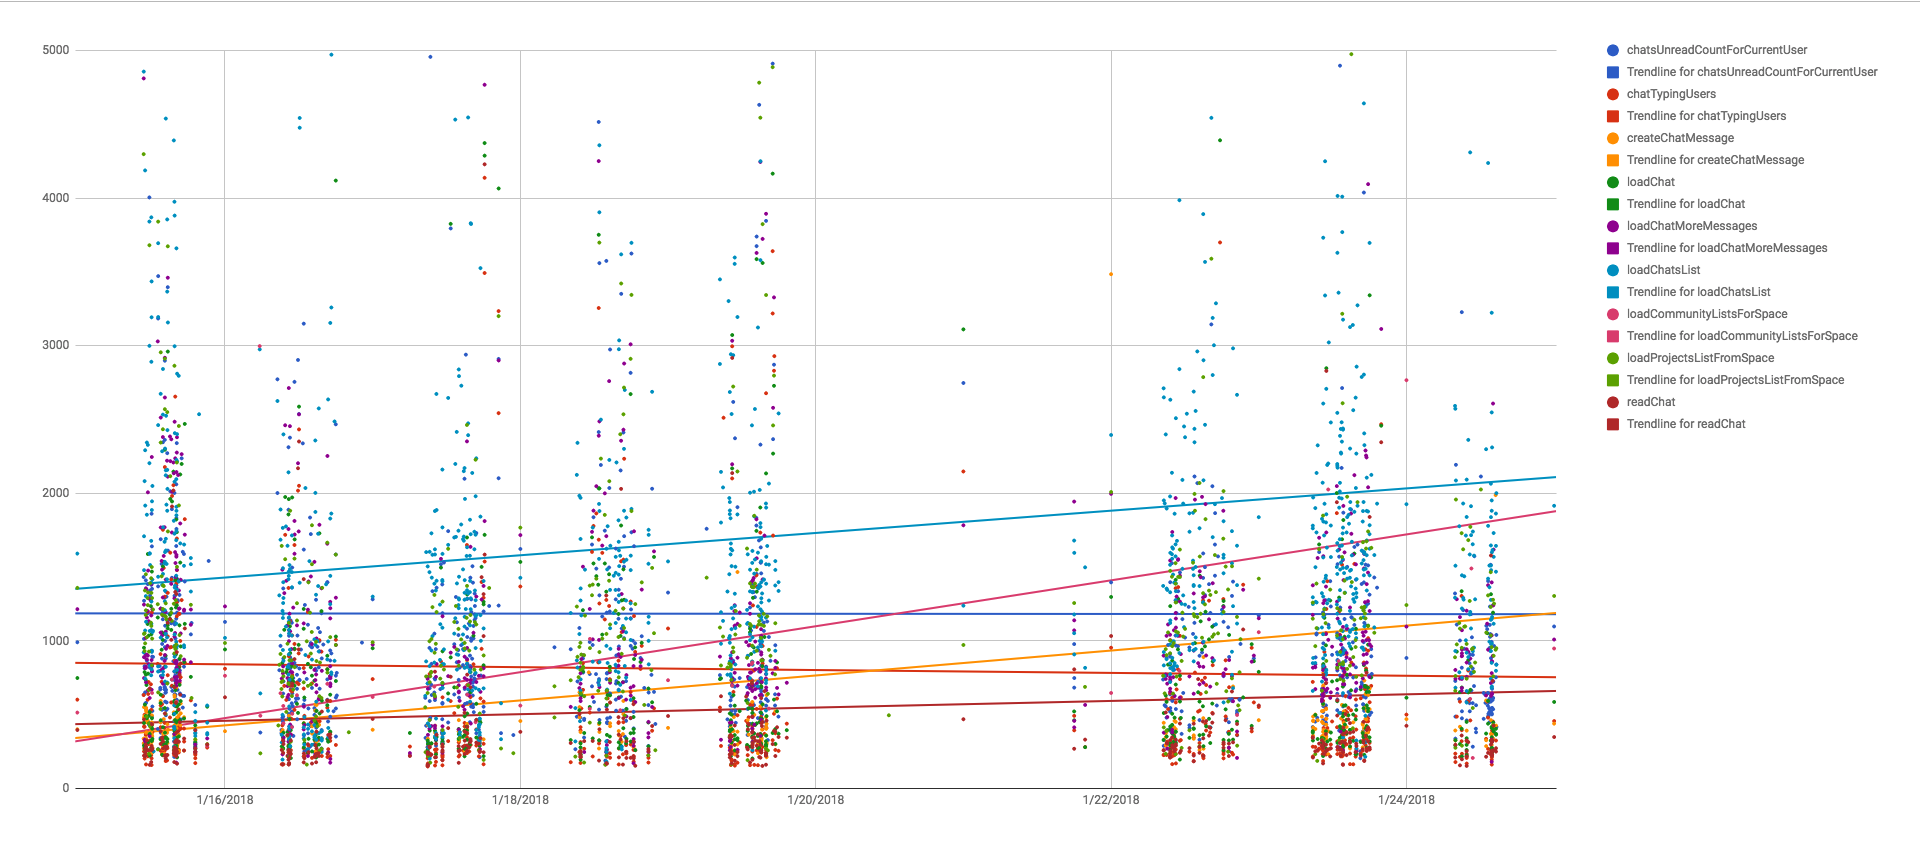
The configuration of the chart is very personal and depend on what type of data you have, here’s an example of time-based performance data.
My favorite chart type for time based performance data is Scatter chart ⤵️

Or the classic Smooth line chart with average values
instead of detailed values ⤵️
instead of detailed values ⤵️
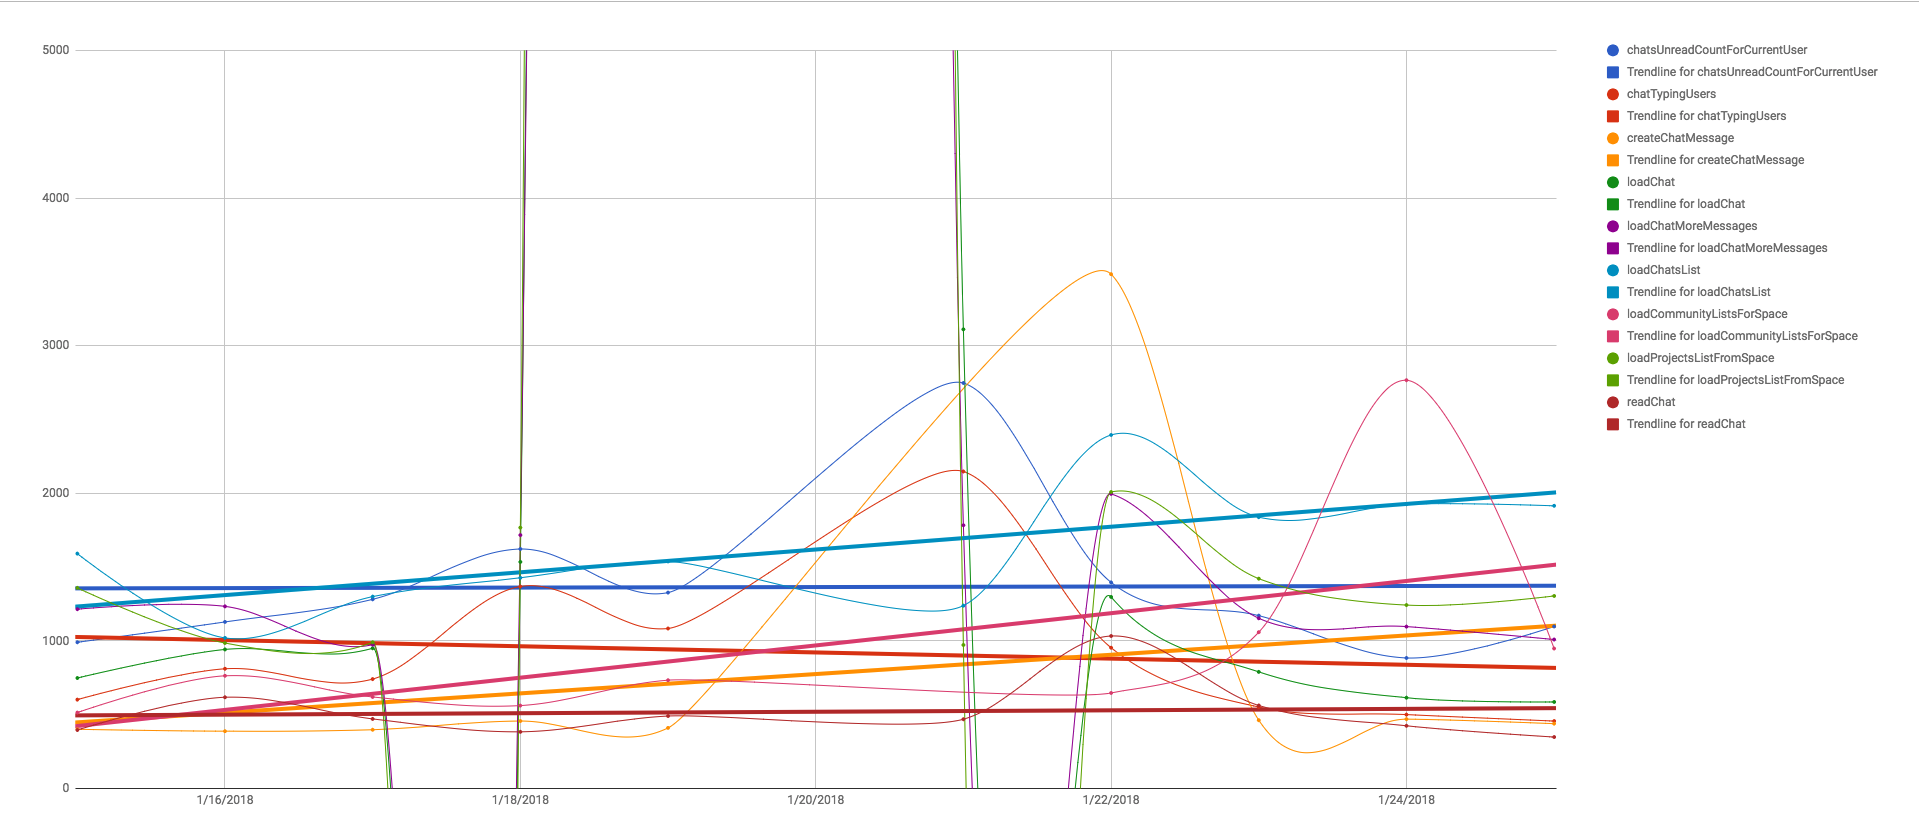
This helps us to see the trend and maximum values in a glance ✨
Conclusion
Pros
- only pay for Lambda execution and Athena query once a week
- very flexible configuration
- geeky 🤓
Cons
- Solutions already exists : ELK, AWS Quicksight, Tableau
- Copy-paste data every week
- not configurable for a non-tech
Future and improvements 📈
CVS file data pasting step
This step is hard to automate easily because AWS Athena create a unique .csv file in S3 each time a query end.
A workaround could be to do 2 things :
A workaround could be to do 2 things :
- update the lambda to save the result of the query in a file named latest.csv and save it publicly on S3.
- Then use awesome IMPORTDATA() function in Google Spreadsheet
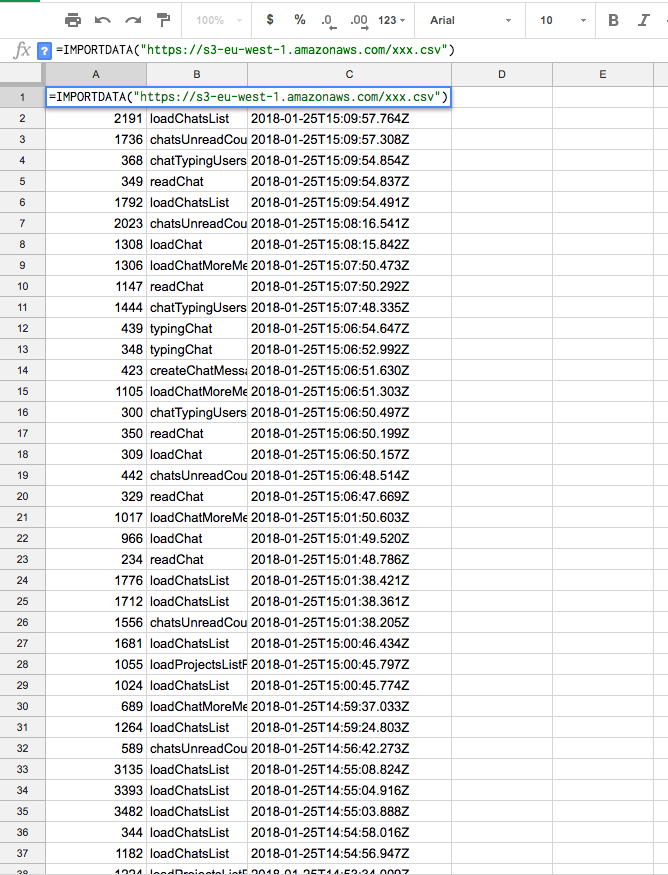
This way, the data will always be the freshest one!
Support for many queries
We may want to create many Athena queries (examples: BI or advanced cross analytics-tools reporting)
For this we can update the Lambda function to update all or many queries.
What about Tableau, AWS Quicksight or Datadog ?
Of course, there is a lot of battle-tested and professional solutions.
This blogpost expose a solution to a specific context with a particular financial and technologic constraints.
We could totally configure Datadog or pay a Tableau licence, but it would not be that fun!
This blogpost expose a solution to a specific context with a particular financial and technologic constraints.
We could totally configure Datadog or pay a Tableau licence, but it would not be that fun!
This is of course an experiment and temporary solution.
We use cookies to collect statistics through Google Analytics.